ZoomPhant can monitor your logs!!! It means you can now put your logs and metrics together in one monitoring solution by using ZoomPhant .
To use log monitoring, you don’t need to do any extra setting, just find one of the log monitoring plugins and start collecting your log. Within few seconds you can view your log data in your monitoring service dashboard or visiting the centrallized Log & Event browsing page, as shown below
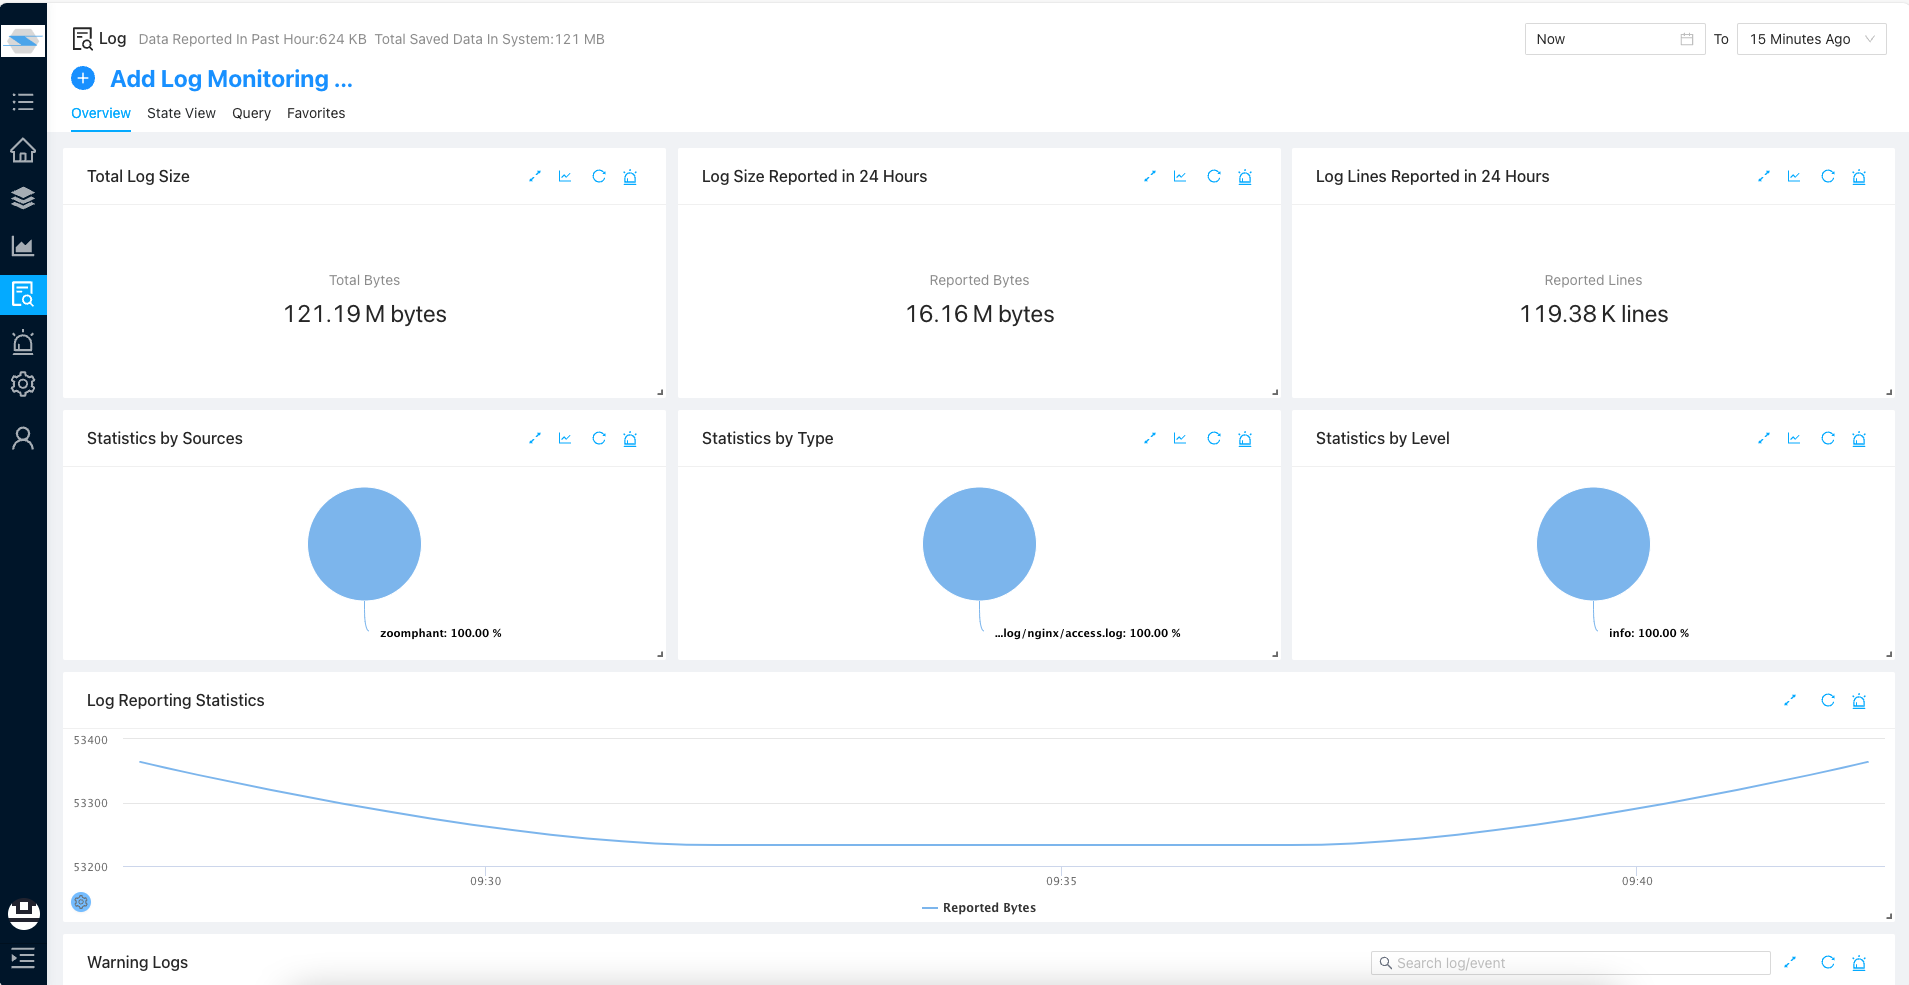
In the Overview tab of Log & Event browsing page, you can see overall status of your log ingestion, and you can also find more details of your log monitoring services in the State View tab:
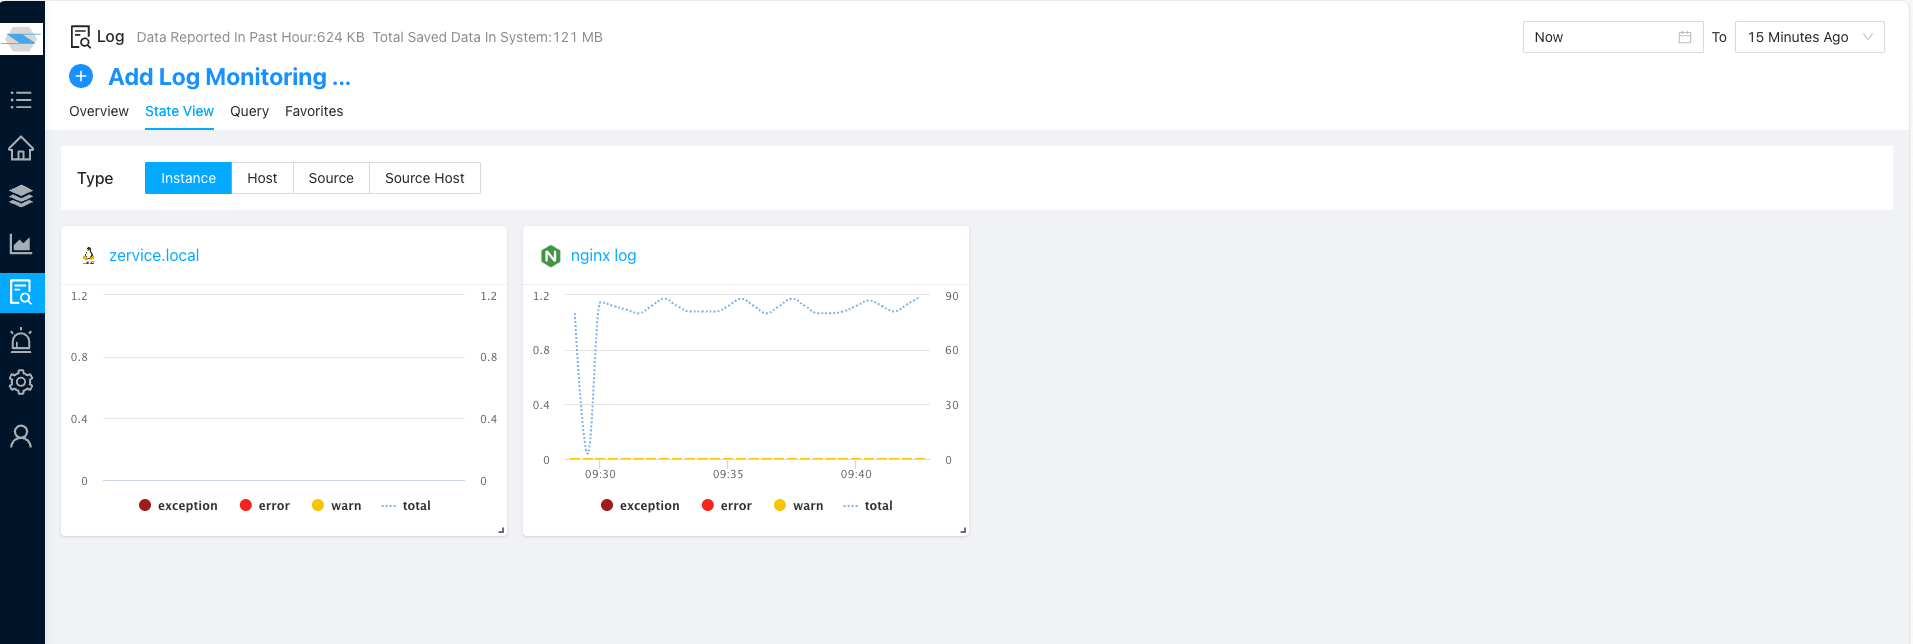
In above tab, you can view a state view of each of your log sources, if you click one of them you may be able to see a more detailed states about the events
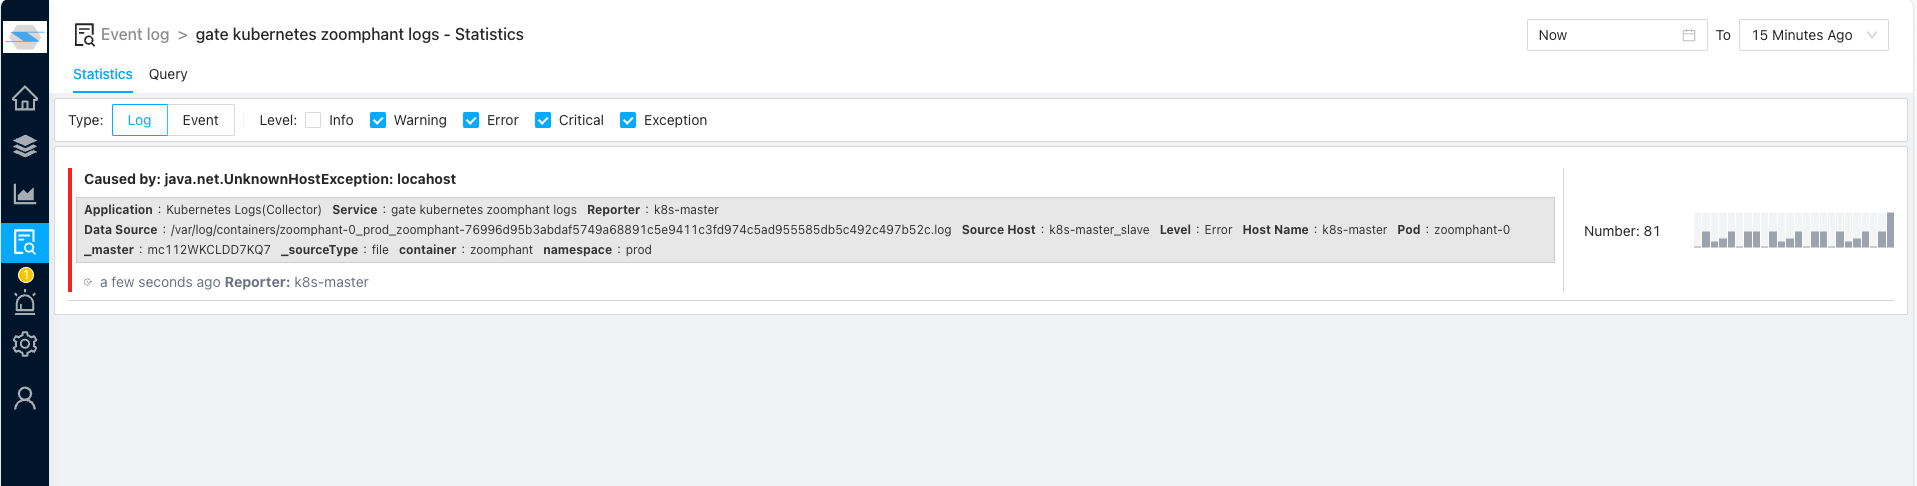
You can click one of the shown events or simply click “Query” to start querying and processing logs from that source:
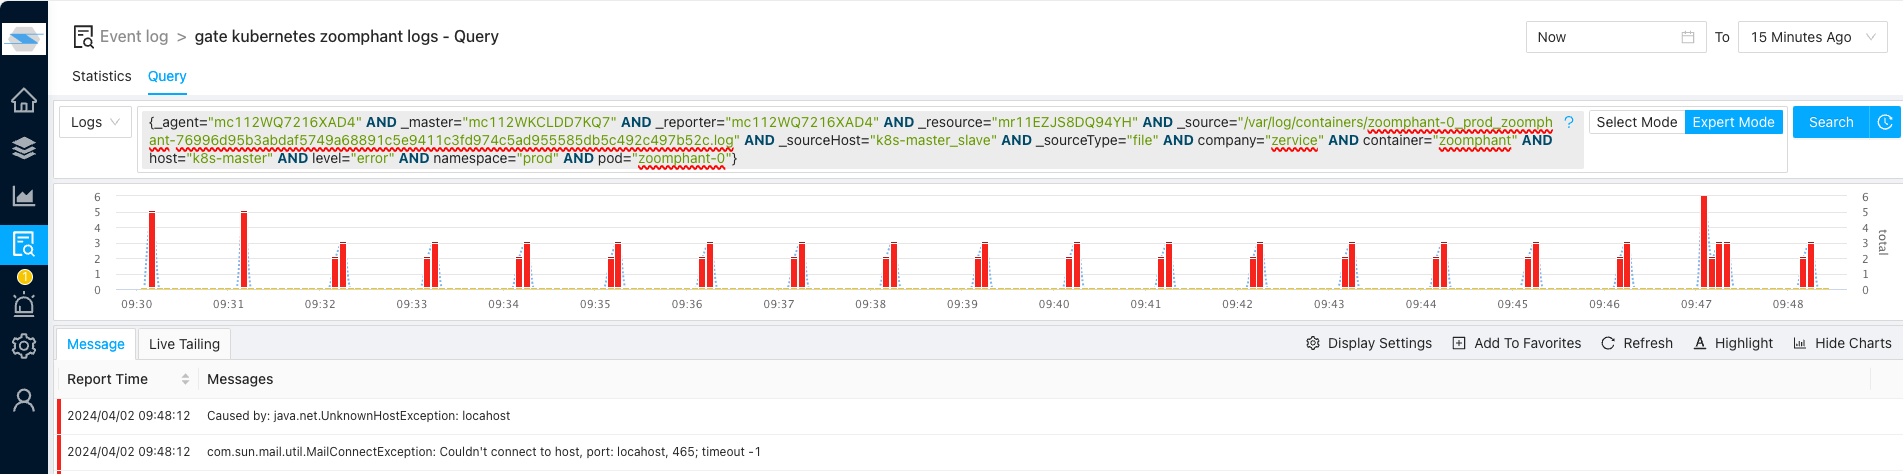
If you want to query logs for all sources, simply click the Query tab in the Log & Event page,:
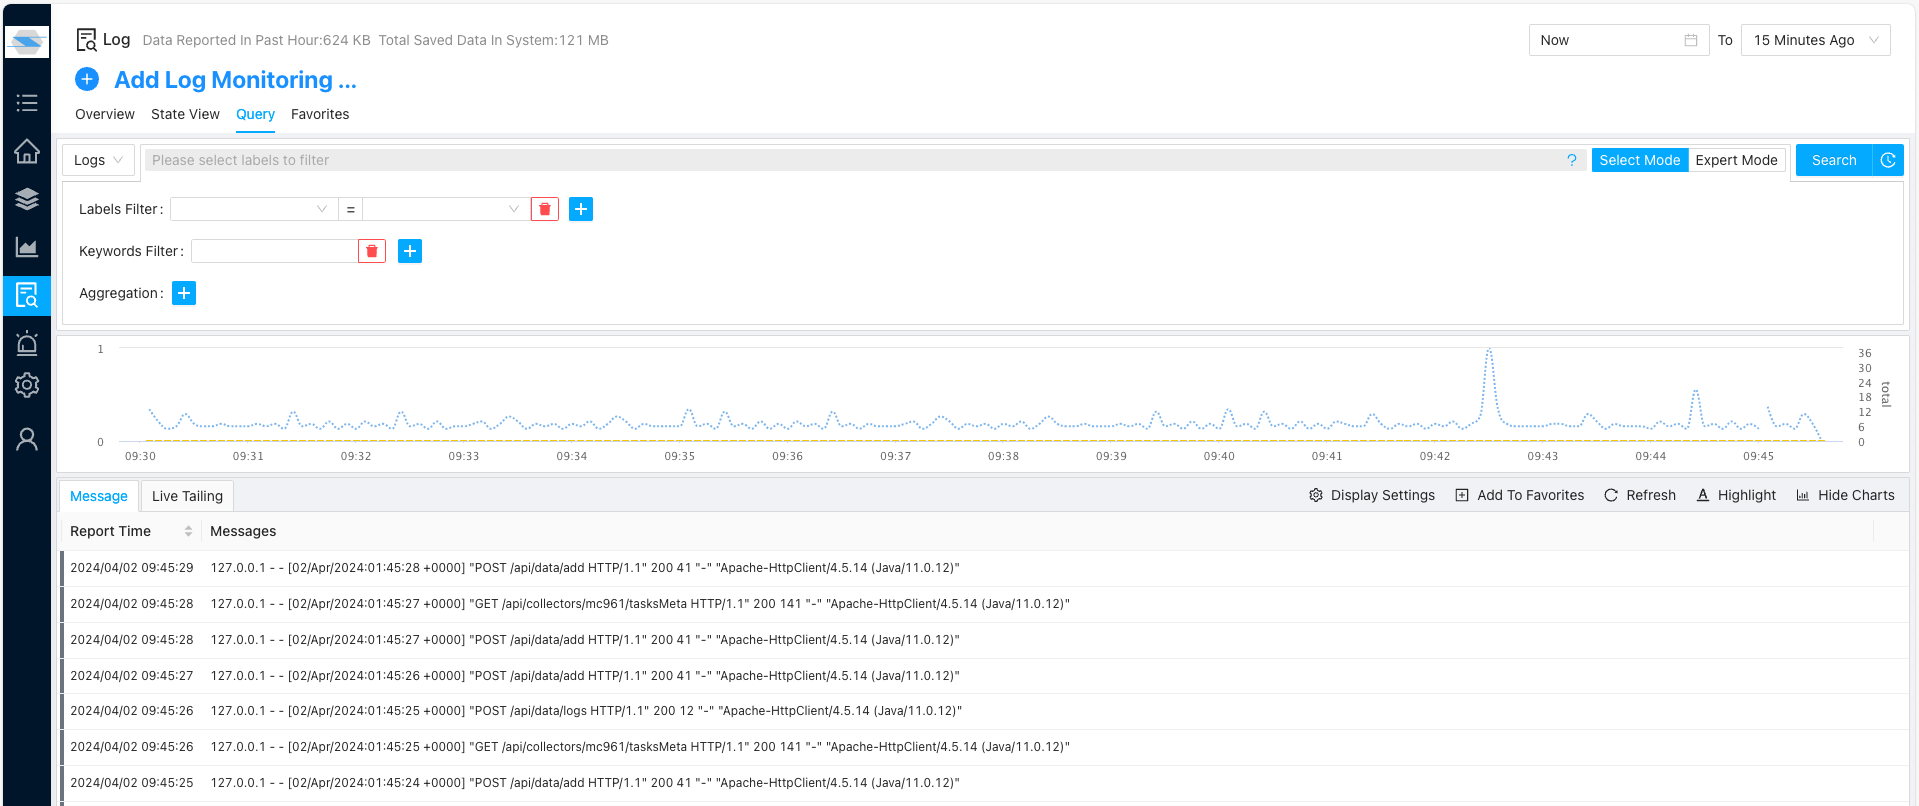
To query and process the logs, you’ll need to refer to our simple log processing language