To help you understand the ZoomPhant Log Query Language, we using a concrete example to help you processing and understanding your logs. In our example, we will try to process the nginx logs generated with following format (refer to your nginx configuration):
log_format combined '$remote_addr - $remote_user [$time_local] '
            '"$request" $status $body_bytes_sent '
            '"$http_referer" "$http_user_agent"';
Before we have performed any processing, the raw logs we have collected is something like follows:
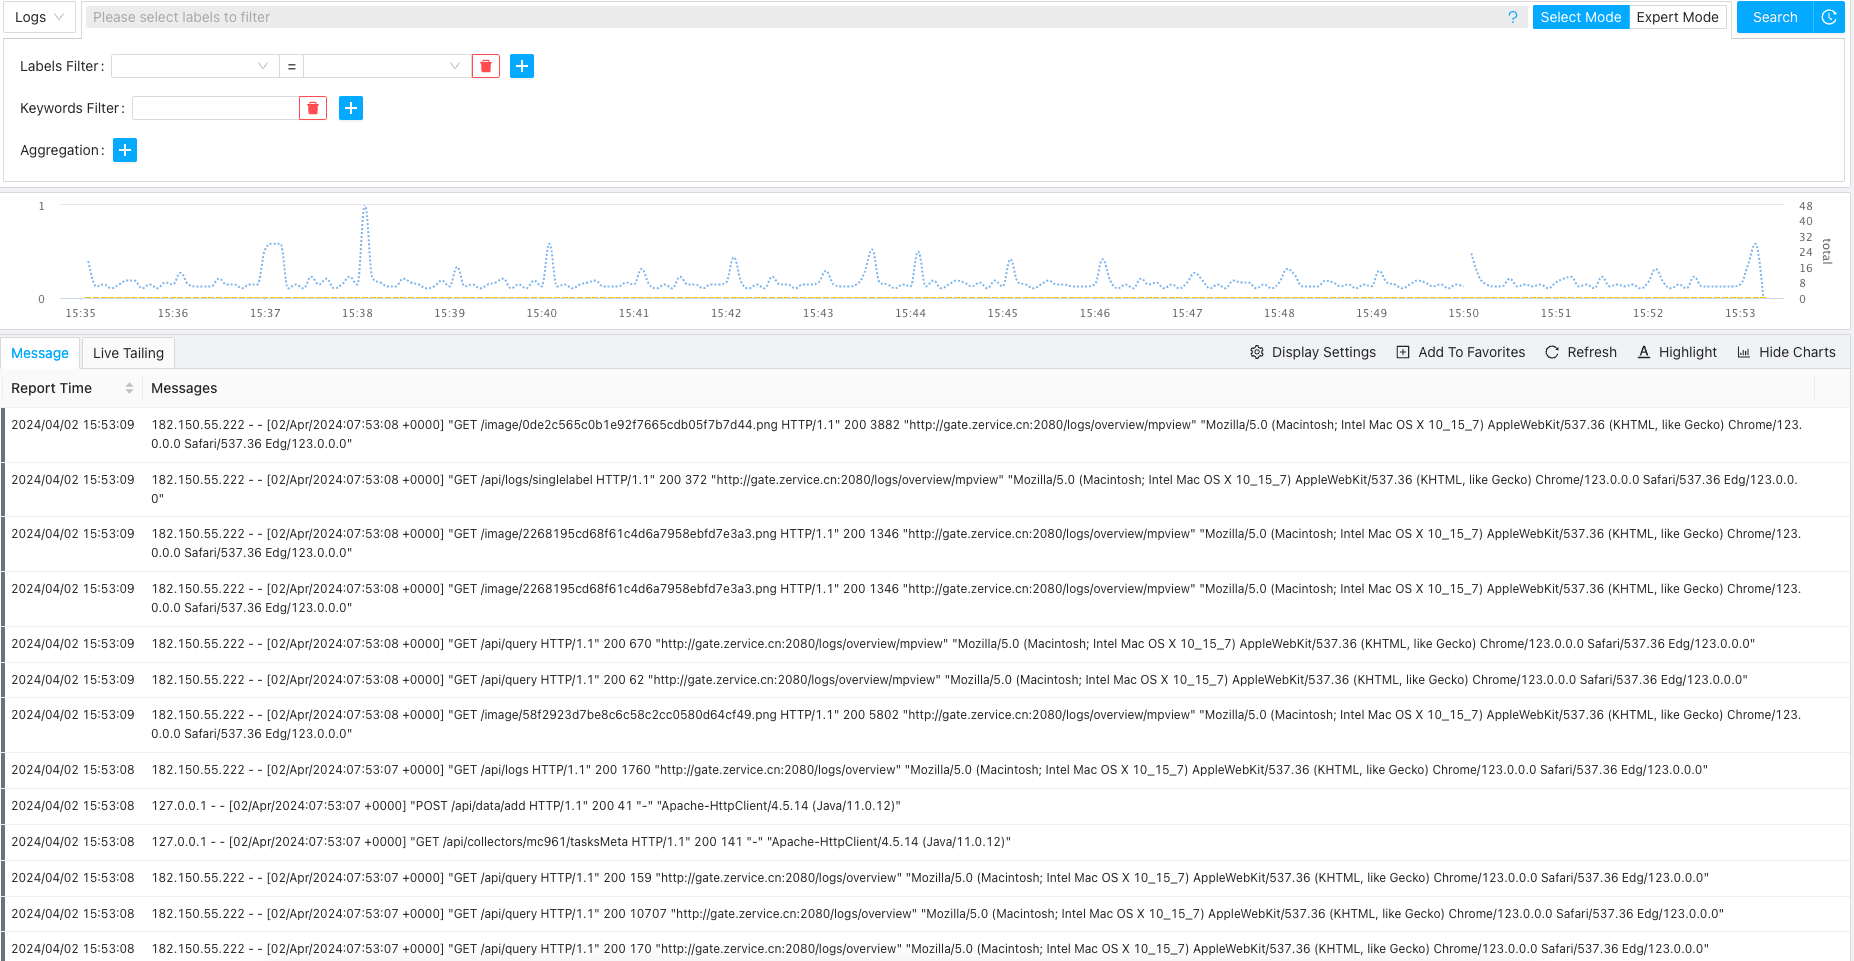
Filtering Logs
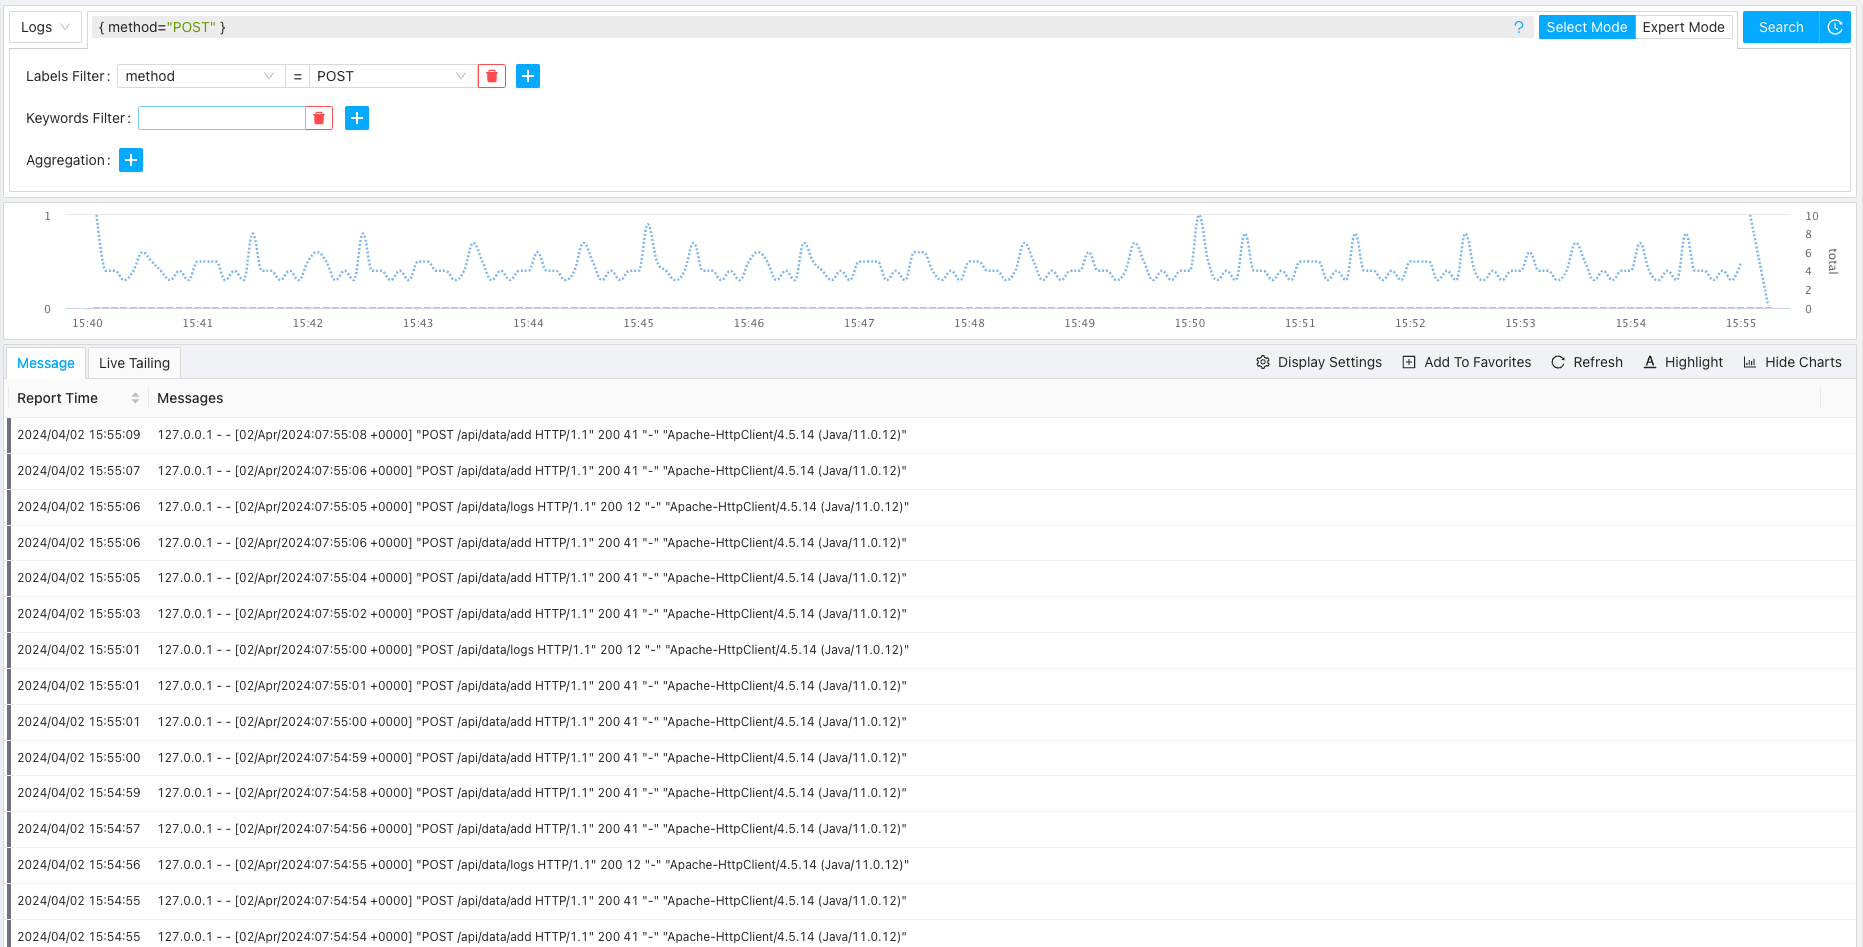
Suppose we just want to process the POST requests, let’s filter the logs using following statement
{method="POST"}
By applying the filter, we can see something like follows
If we want to filter non-POST requests, we can using a filter statement like follows
{method!="POST"}
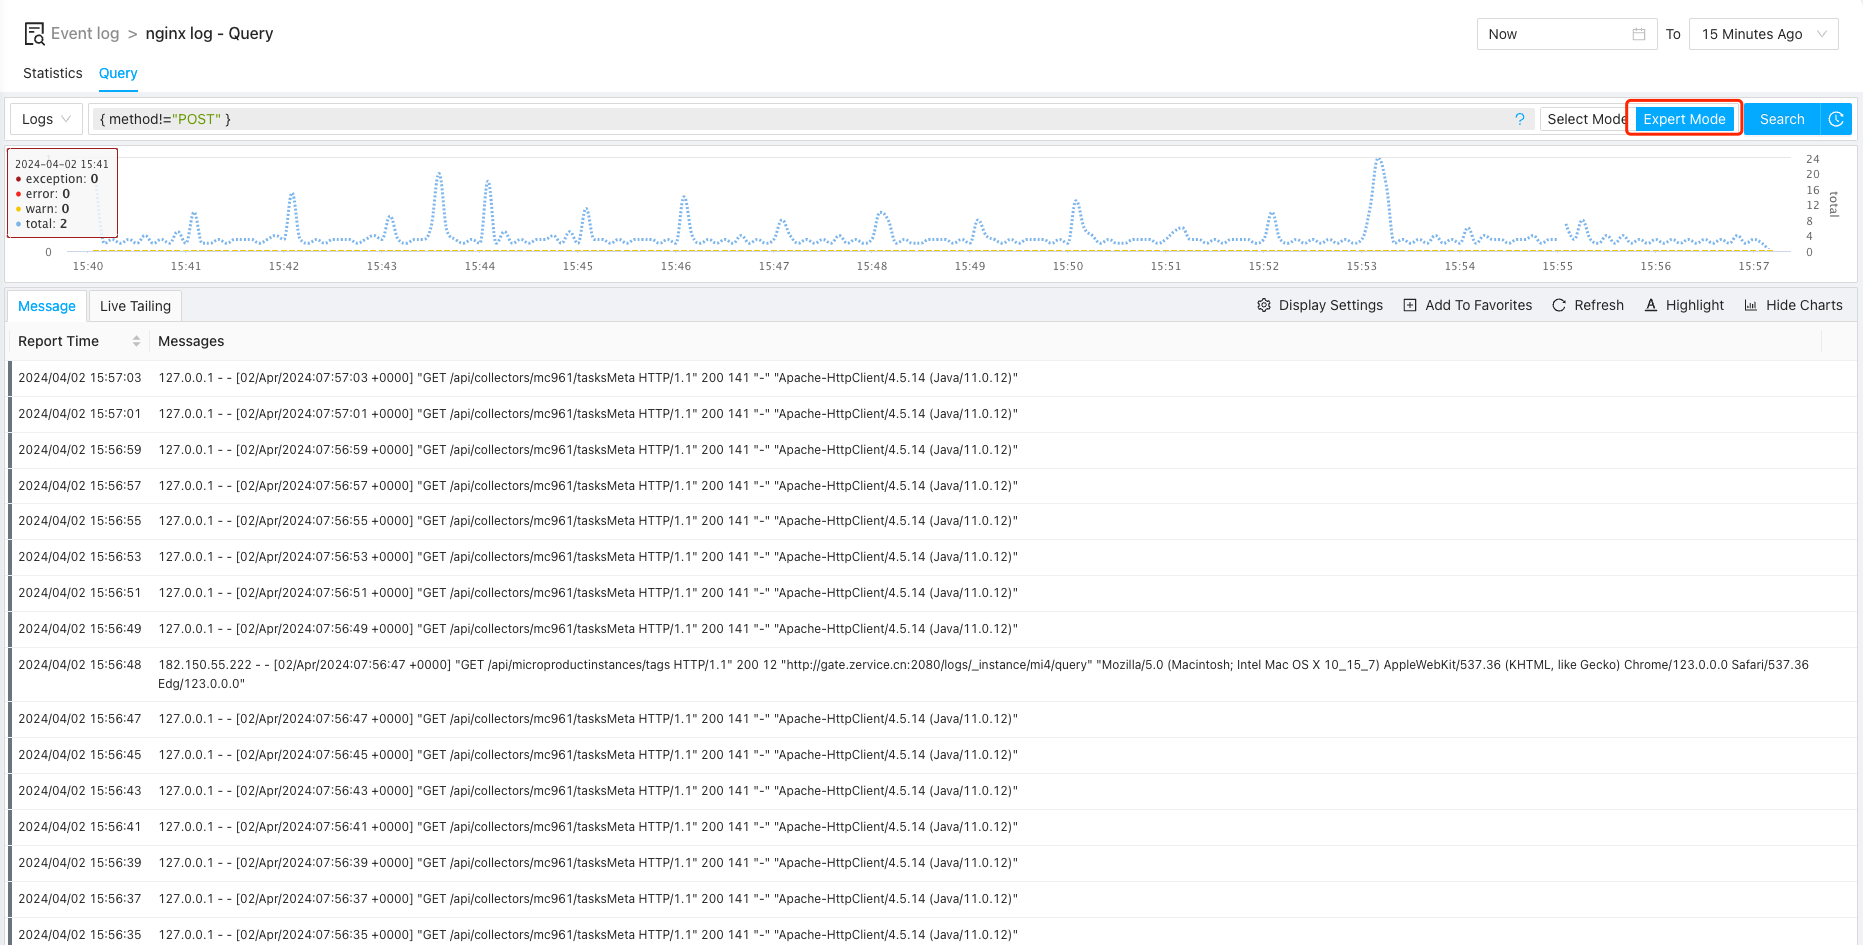
Note: here we shall switch to expert mode for this as selection mode only for more basic usage
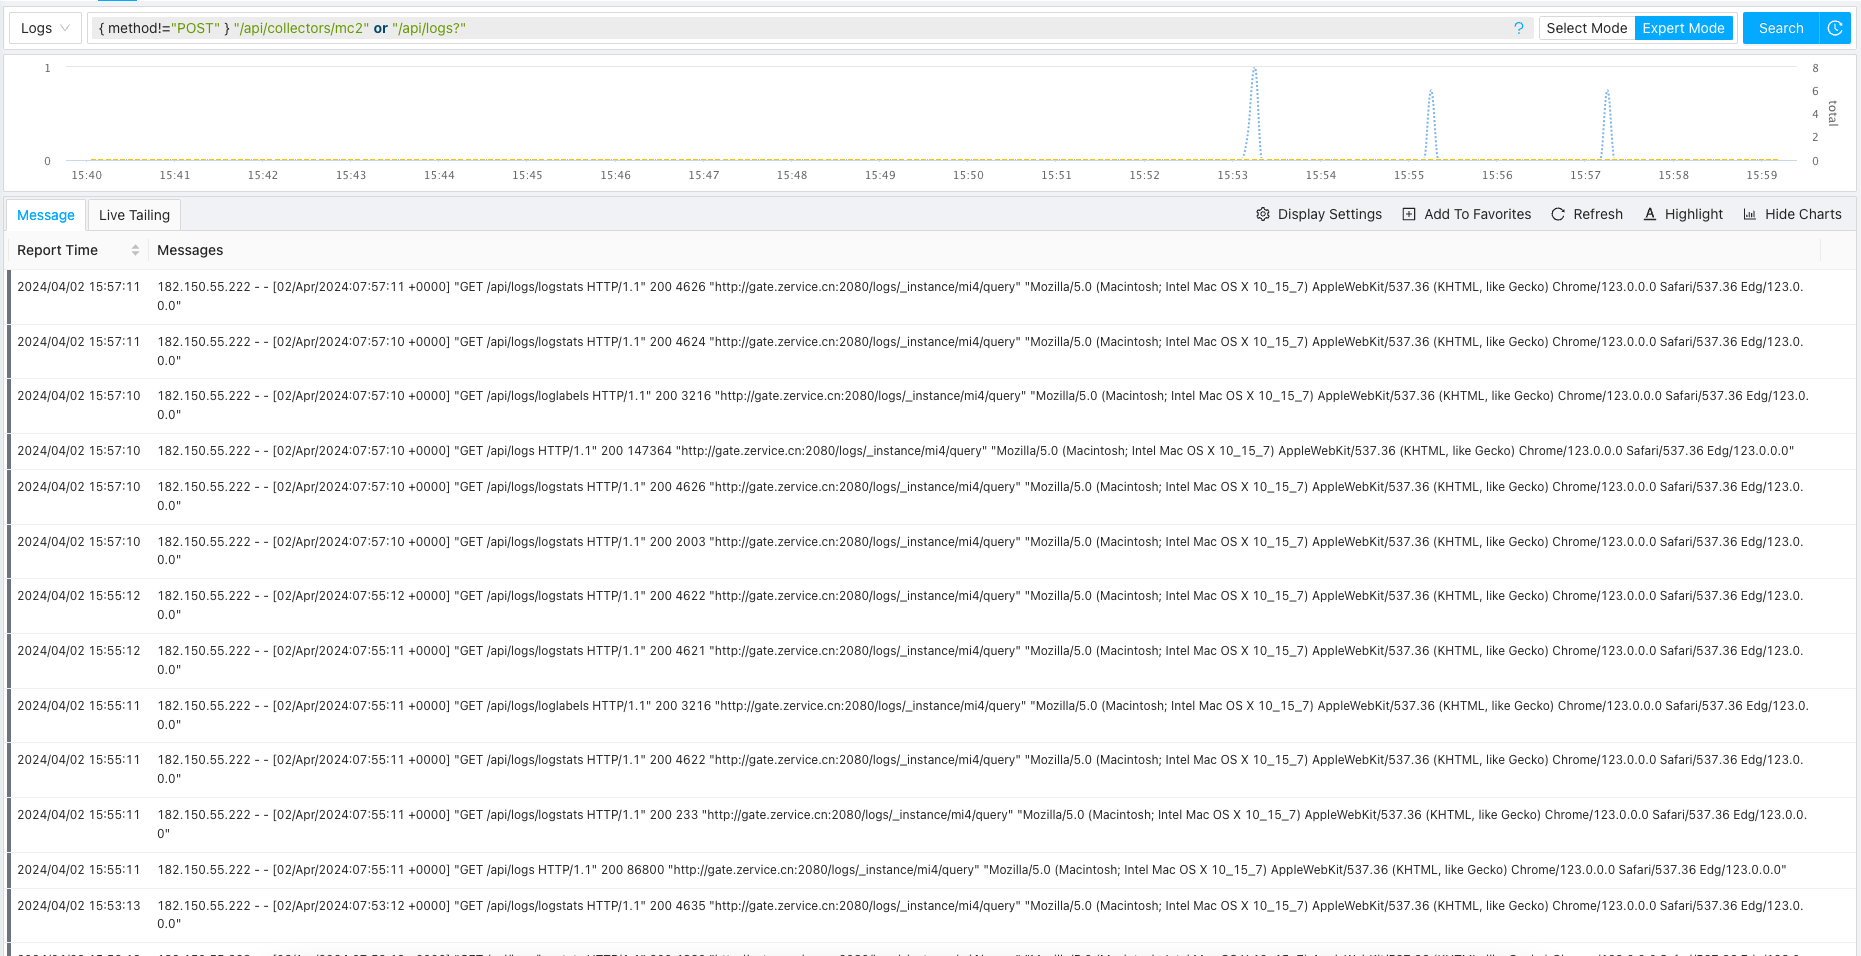
Continue with above example, let’s just try to filter logs for some special apis:
{method!="POST"} "/api/collectors/mc2" or "/api/logs?"
We now have following:
Using Log Processing Functions
With above filtering, we now limit our logs to a much smaller set, and we can further processing our logs to
- Extract more important information dynamically
- Further filtering / processing the processed logs
Extracting More Labels
In the raw nginx log, there are no labels like ip, referer, etc.:
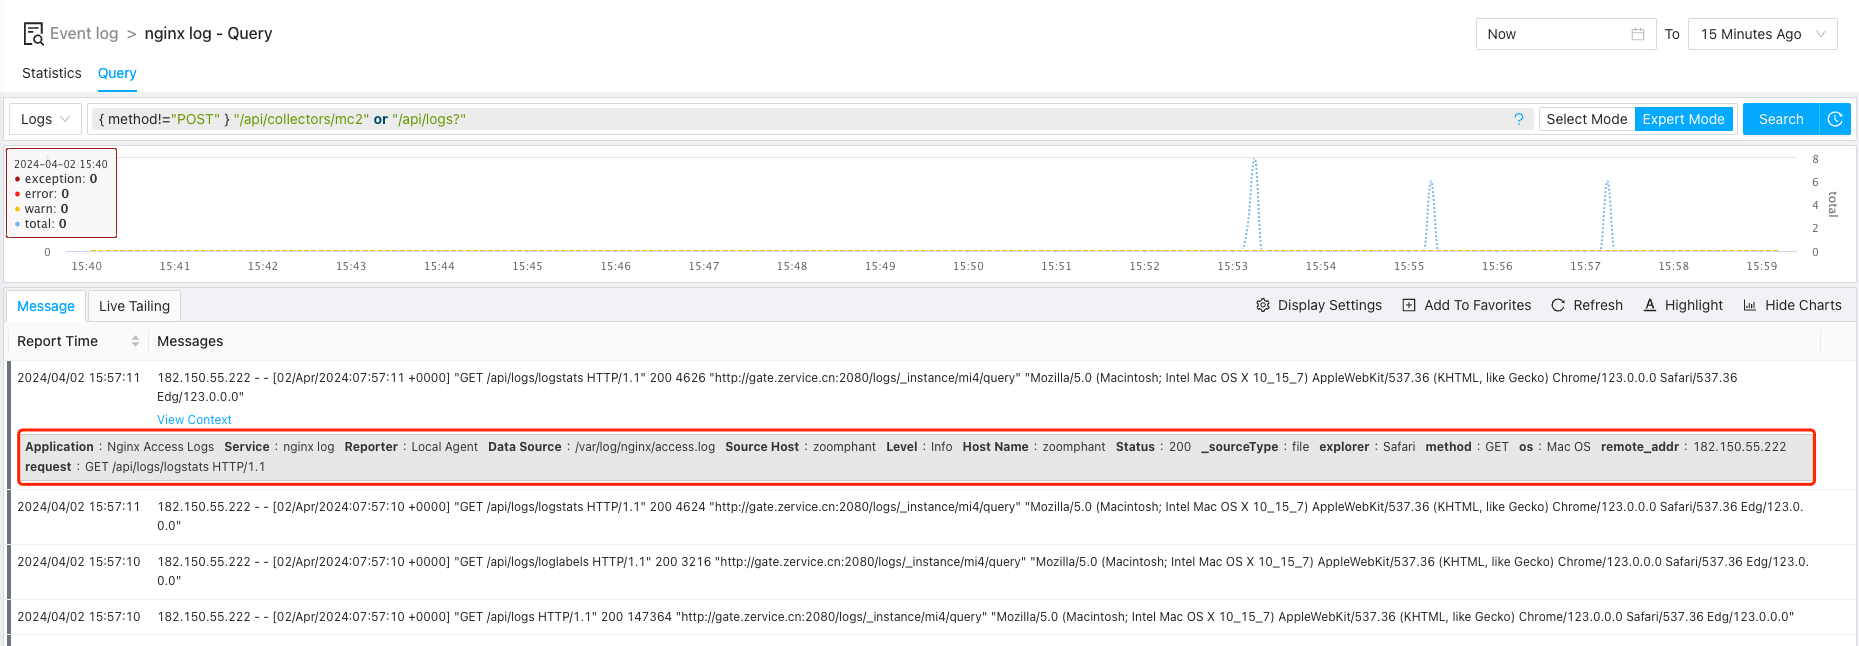
But those labels might be very useful to understand Nginx logs, we can try to extract them from the logs lines as
- ip: the IP address sending the request
- ver: HTTP request version
- size: the size in bytes of the responses from the server
- referer: the page sending the request (i.e. referer of the request)
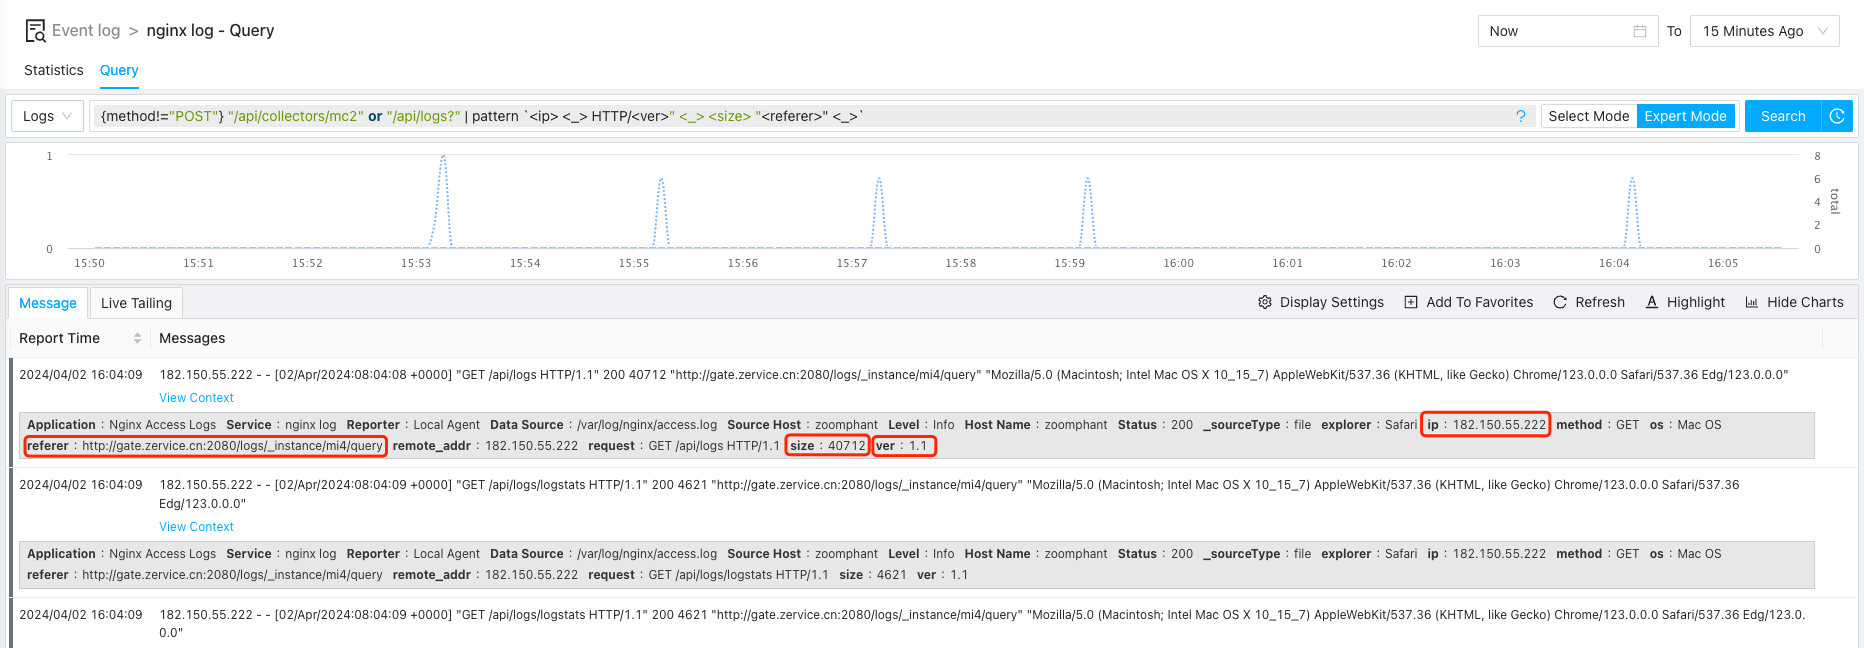
We can use pattern function to get this done:
{method!="POST"} "/api/collectors/mc2" or "/api/logs?" | pattern `<ip> <_> HTTP/<ver>" <_> <size> "<referer>" <_>`
Note: we are using ticked string here to be able to use double quotes in the pattern argument
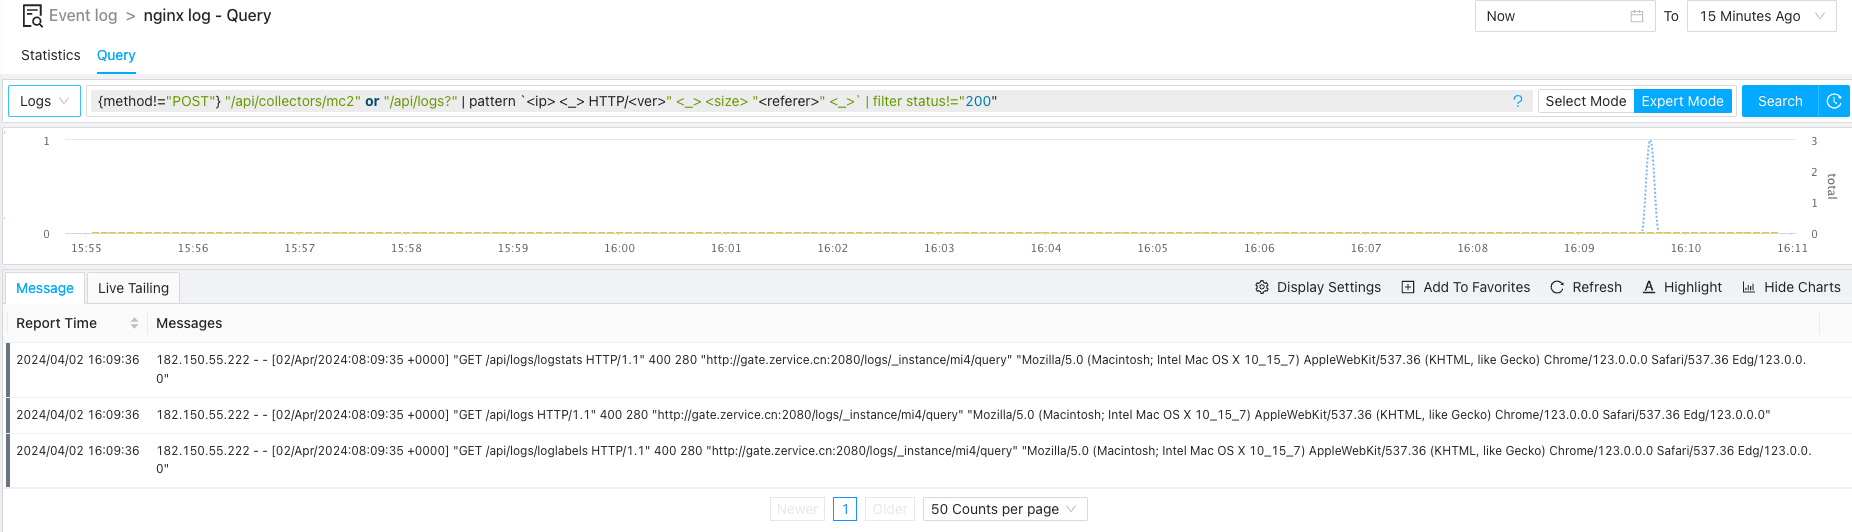
Suppose we want to find requests that are not processed successfully (status != 200), we can expand our query statement with another filter stage as follows:
{method!="POST"} "/api/collectors/mc2" or "/api/logs?" | pattern `<ip> <_> HTTP/<ver>" <_> <size> "<referer>" <_>` | filter status!="200"
We now have:
Vectorizing Logs and Display
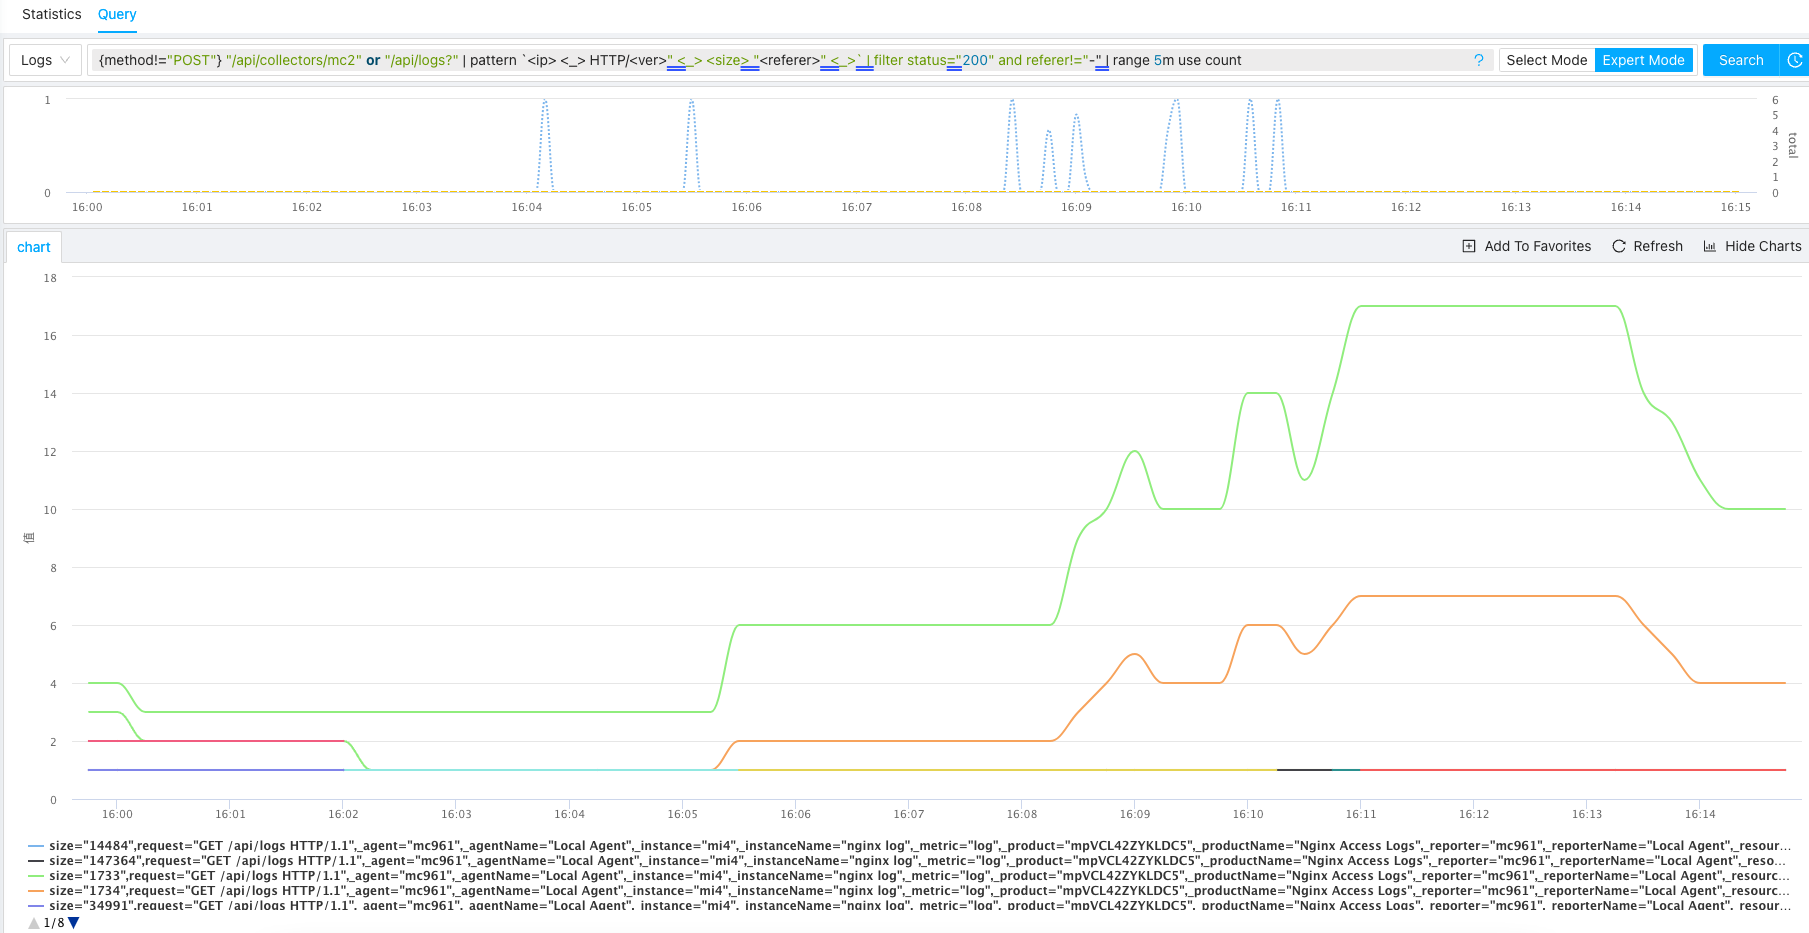
Now suppose we want to see the pattern of the successful requests in a 5 minute step, we can do this using following query statement:
{method!="POST"} "/api/collectors/mc2" or "/api/logs?" | pattern `<ip> <_> HTTP/<ver>" <_> <size> "<referer>" <_>` | filter status="200" and referer!="-" | range 5m use count
We now have our output displayed in lines as follows:
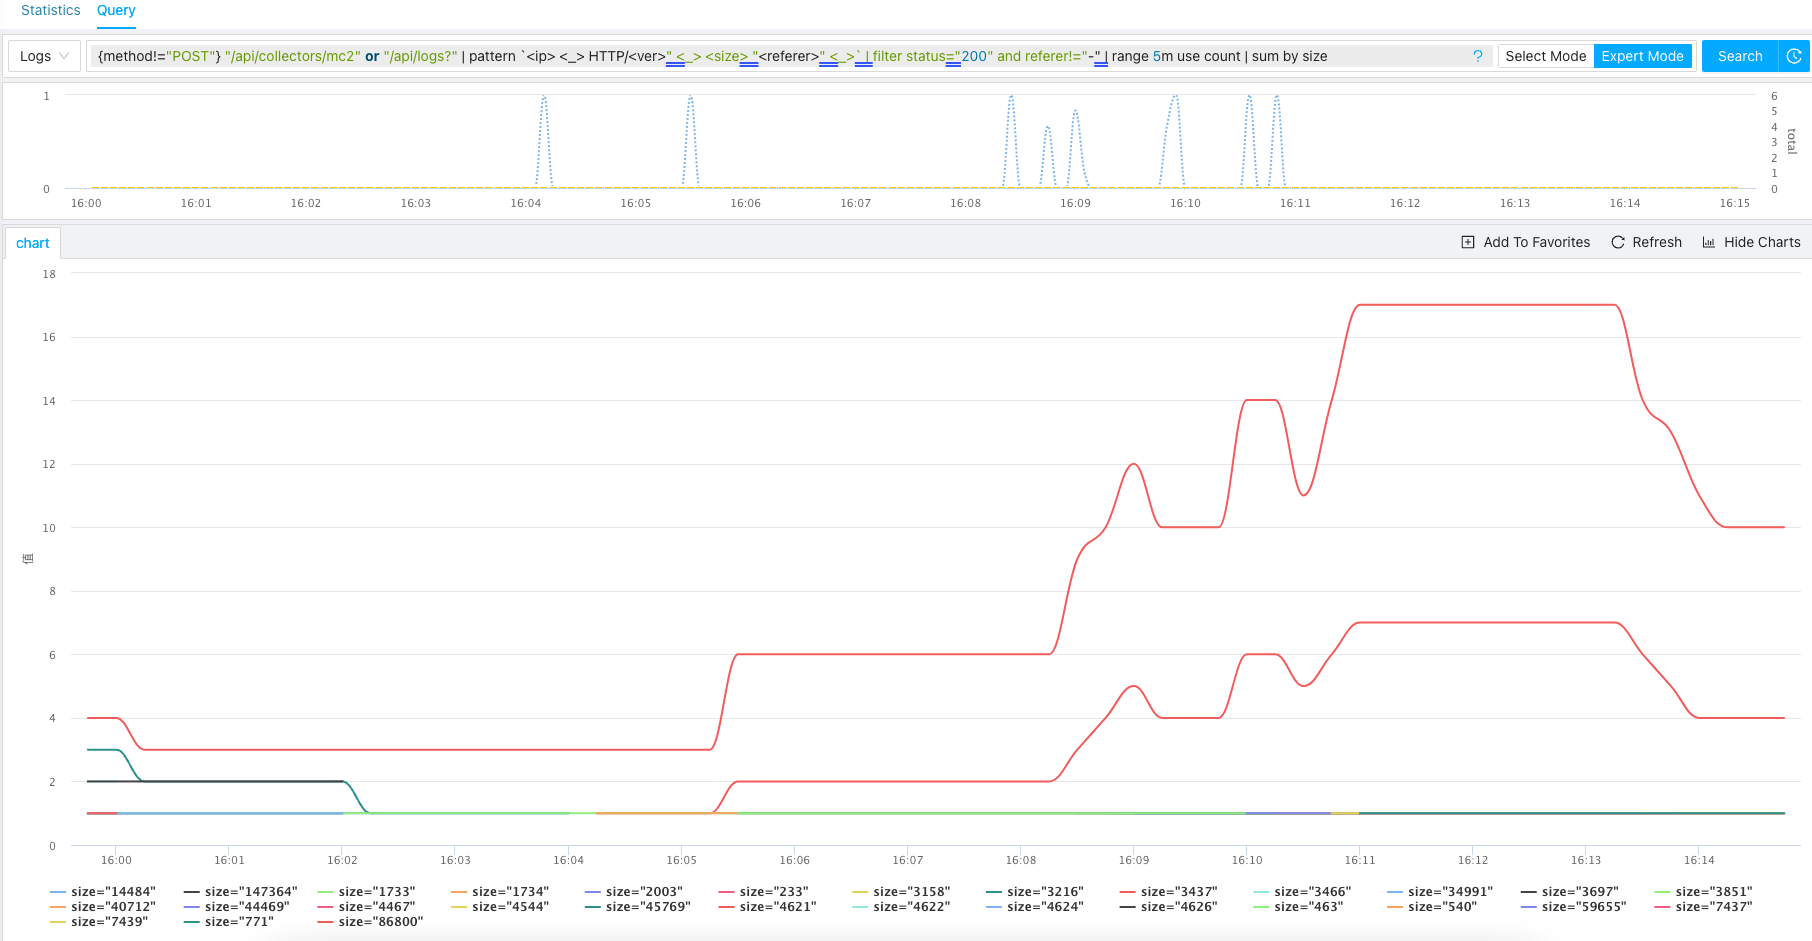
We can try to get a stats by response size by sumiming against size using following statement
{method!="POST"} "/api/collectors/mc2" or "/api/logs?" | pattern `<ip> <_> HTTP/<ver>" <_> <size> "<referer>" <_>` | filter status="200" and referer!="-" | range 5m use count | sum by size
We now have:
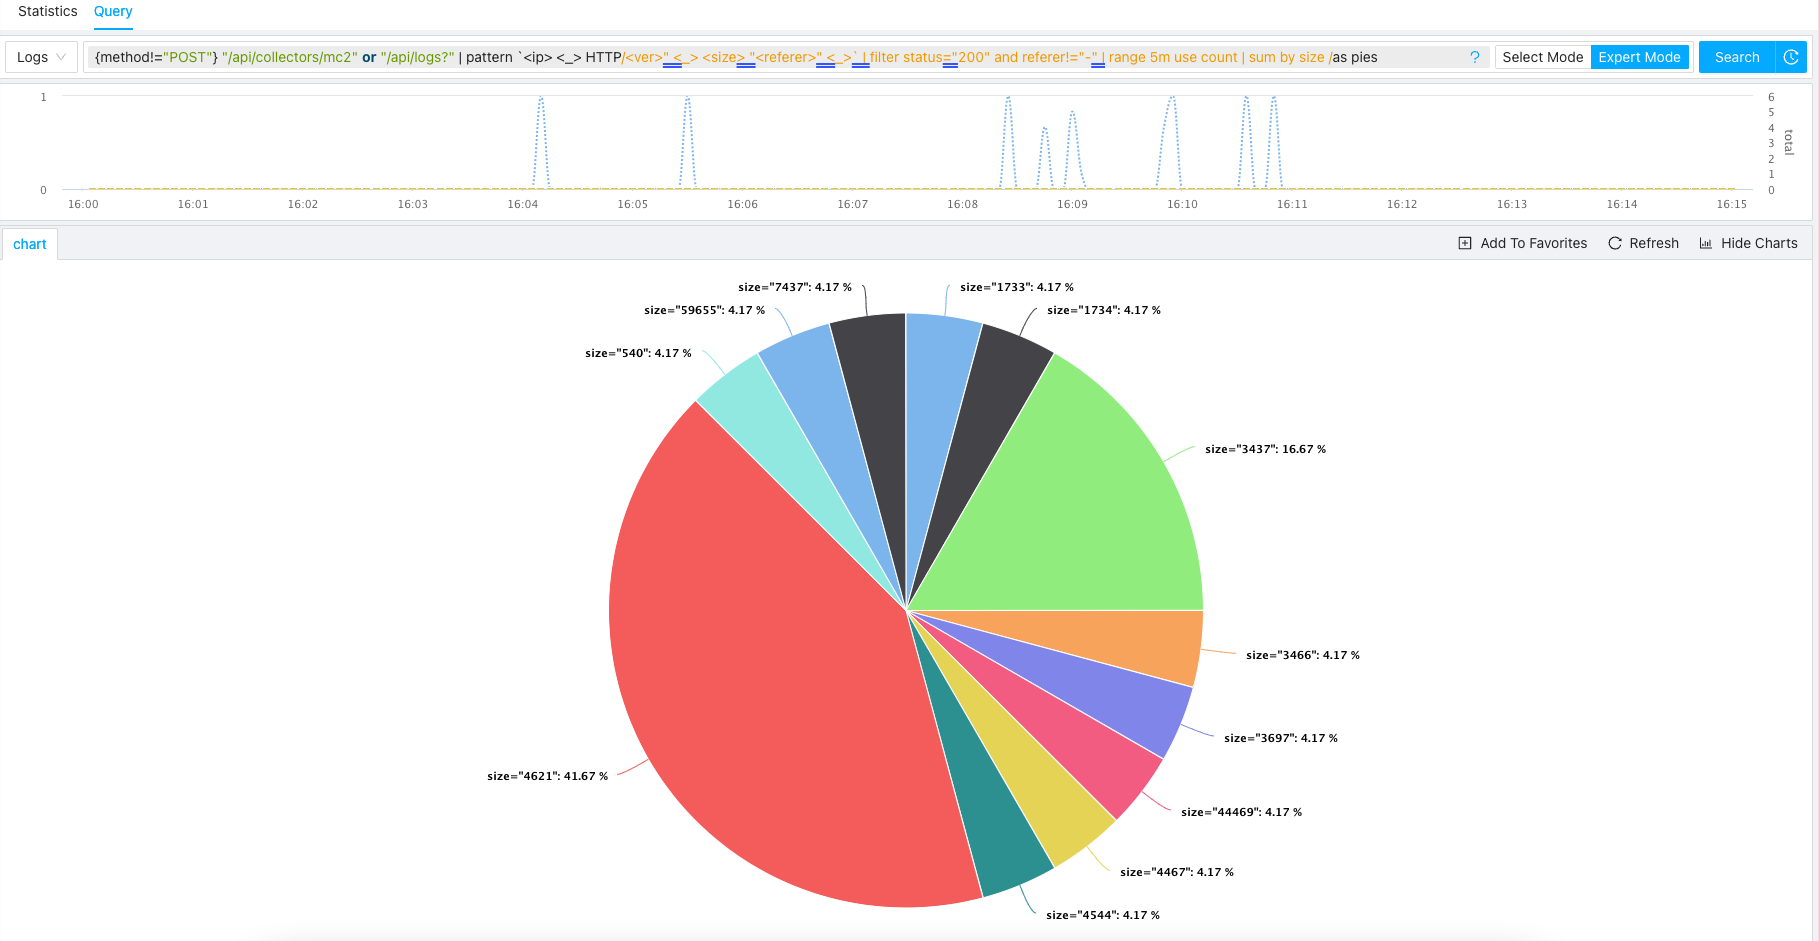
If we want to take a look at current distribution by size, it would be better to view the data in pies, so let’s add pies display options as follows:
{method!="POST"} "/api/collectors/mc2" or "/api/logs?" | pattern `<ip> <_> HTTP/<ver>" <_> <size> "<referer>" <_>` | filter status="200" and referer!="-" | range 5m use count | sum by size /as pies
Now we would have data be shown in pies as following: