HTTP Monitoring
HTTP is one of the most widely used protocol. By supporting HTTP monitoring, ZoomPhant enable you to monitor a web server in just few seconds.
Creating HTTP Monitoring
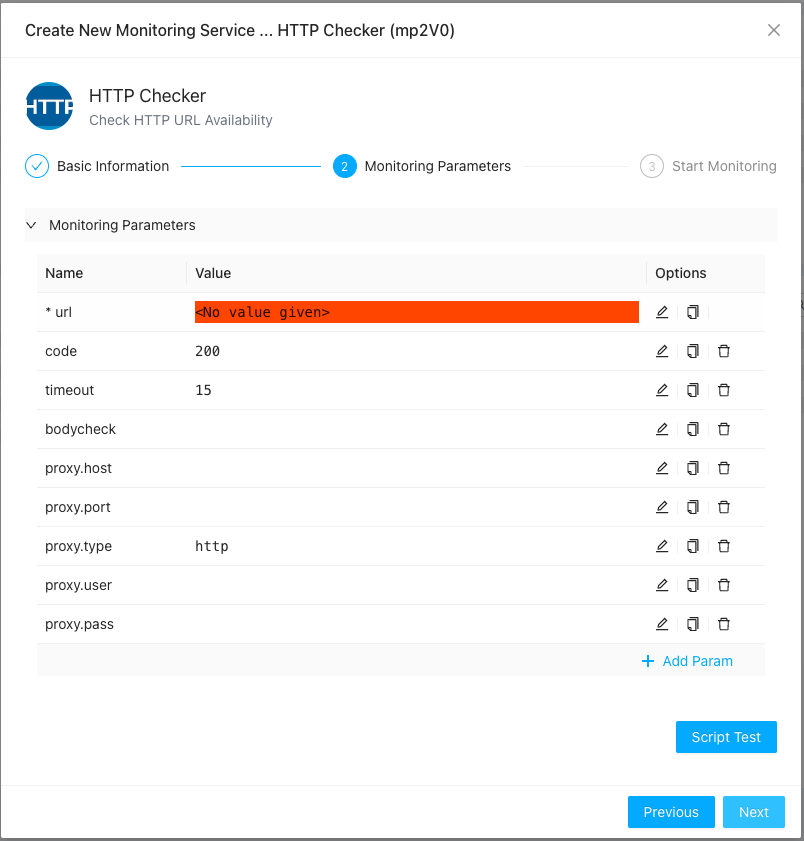
To create a HTTP monitoring, you just follow the instruction in Add Monitor Service to select the HTTP Checker plugin and provides following parameters
Here:
- url: the only required parameter required for HTTP Checker to work. It will try to perform a HTTP GET check against this given URL
- code: the expected HTTP response code, default to 200 (OK)
- timeout: the expire time in seconds, default to 15 seconds
- bodycheck: for advanced user only. A JSON object describe how to check the HTTP responses, it allows you to match the returned HTTP response using different syntax like check against JSON path or XML path, etc. The JSON object shall contains following field
- format: how to interpret the JSON object, the value could be “json” or “xml”
- path: depends on format, it could be a JSON path or XML path
- value: the value to check against. We will take the value as string
- op: what kind of check you want to check, like “equal”, “notEqual”, “contain”, “notContain”, “exist”, “notExist”, “match”, “notMatch”. an example: (which will check the json value
$.result.datawill equal totest){ "format": "json", "path": "$.result.data", "value": "test", "op": "equal" }
- proxy.host / proxy.port: the proxy server to use if you need to access the url after a proxy
- proxy.user / proxy.pass: the proxy user name and password if required
- proxy.type: type of proxy to use, by default it’s a HTTP proxy.
- method: optional. set the http method. GET or POST. default is GET.
- body: optional. set the http post body. default is empty if method is POST.
- headers: optional. set the http request headers. It’s a json array. an example:
[ {"name": "Authorization", "value": "Bear XXXX"} ] - metrics: for advanced user only. A JSON array which can be used to extract metrics from the http body or http header. each object has below format:
- name : the name of the metric. The final metric name will be added a prefix: “metric.”
- extractorSource : which part will be used to extract metric. values: header/responsebody.
- extractorMethod : how to extract the metric. values: values: xml/json/regex.
- extractorParams : the params. for xml, it’s xml path. for json, it’s json path. for regex, it’s the regex expression. an example: (this will report a metric
metric.productNumberwith the value of$.data.productNum)[ { "name": "productNumber", "extractorSource" : "responsebody", "extractorMethod": "json", "extractorParams": ["$.data.productNum"] } ]
Understanding the HTTP Checker Data
Once you have added the monitoring service, you can navigate to it and see the collected data as follows
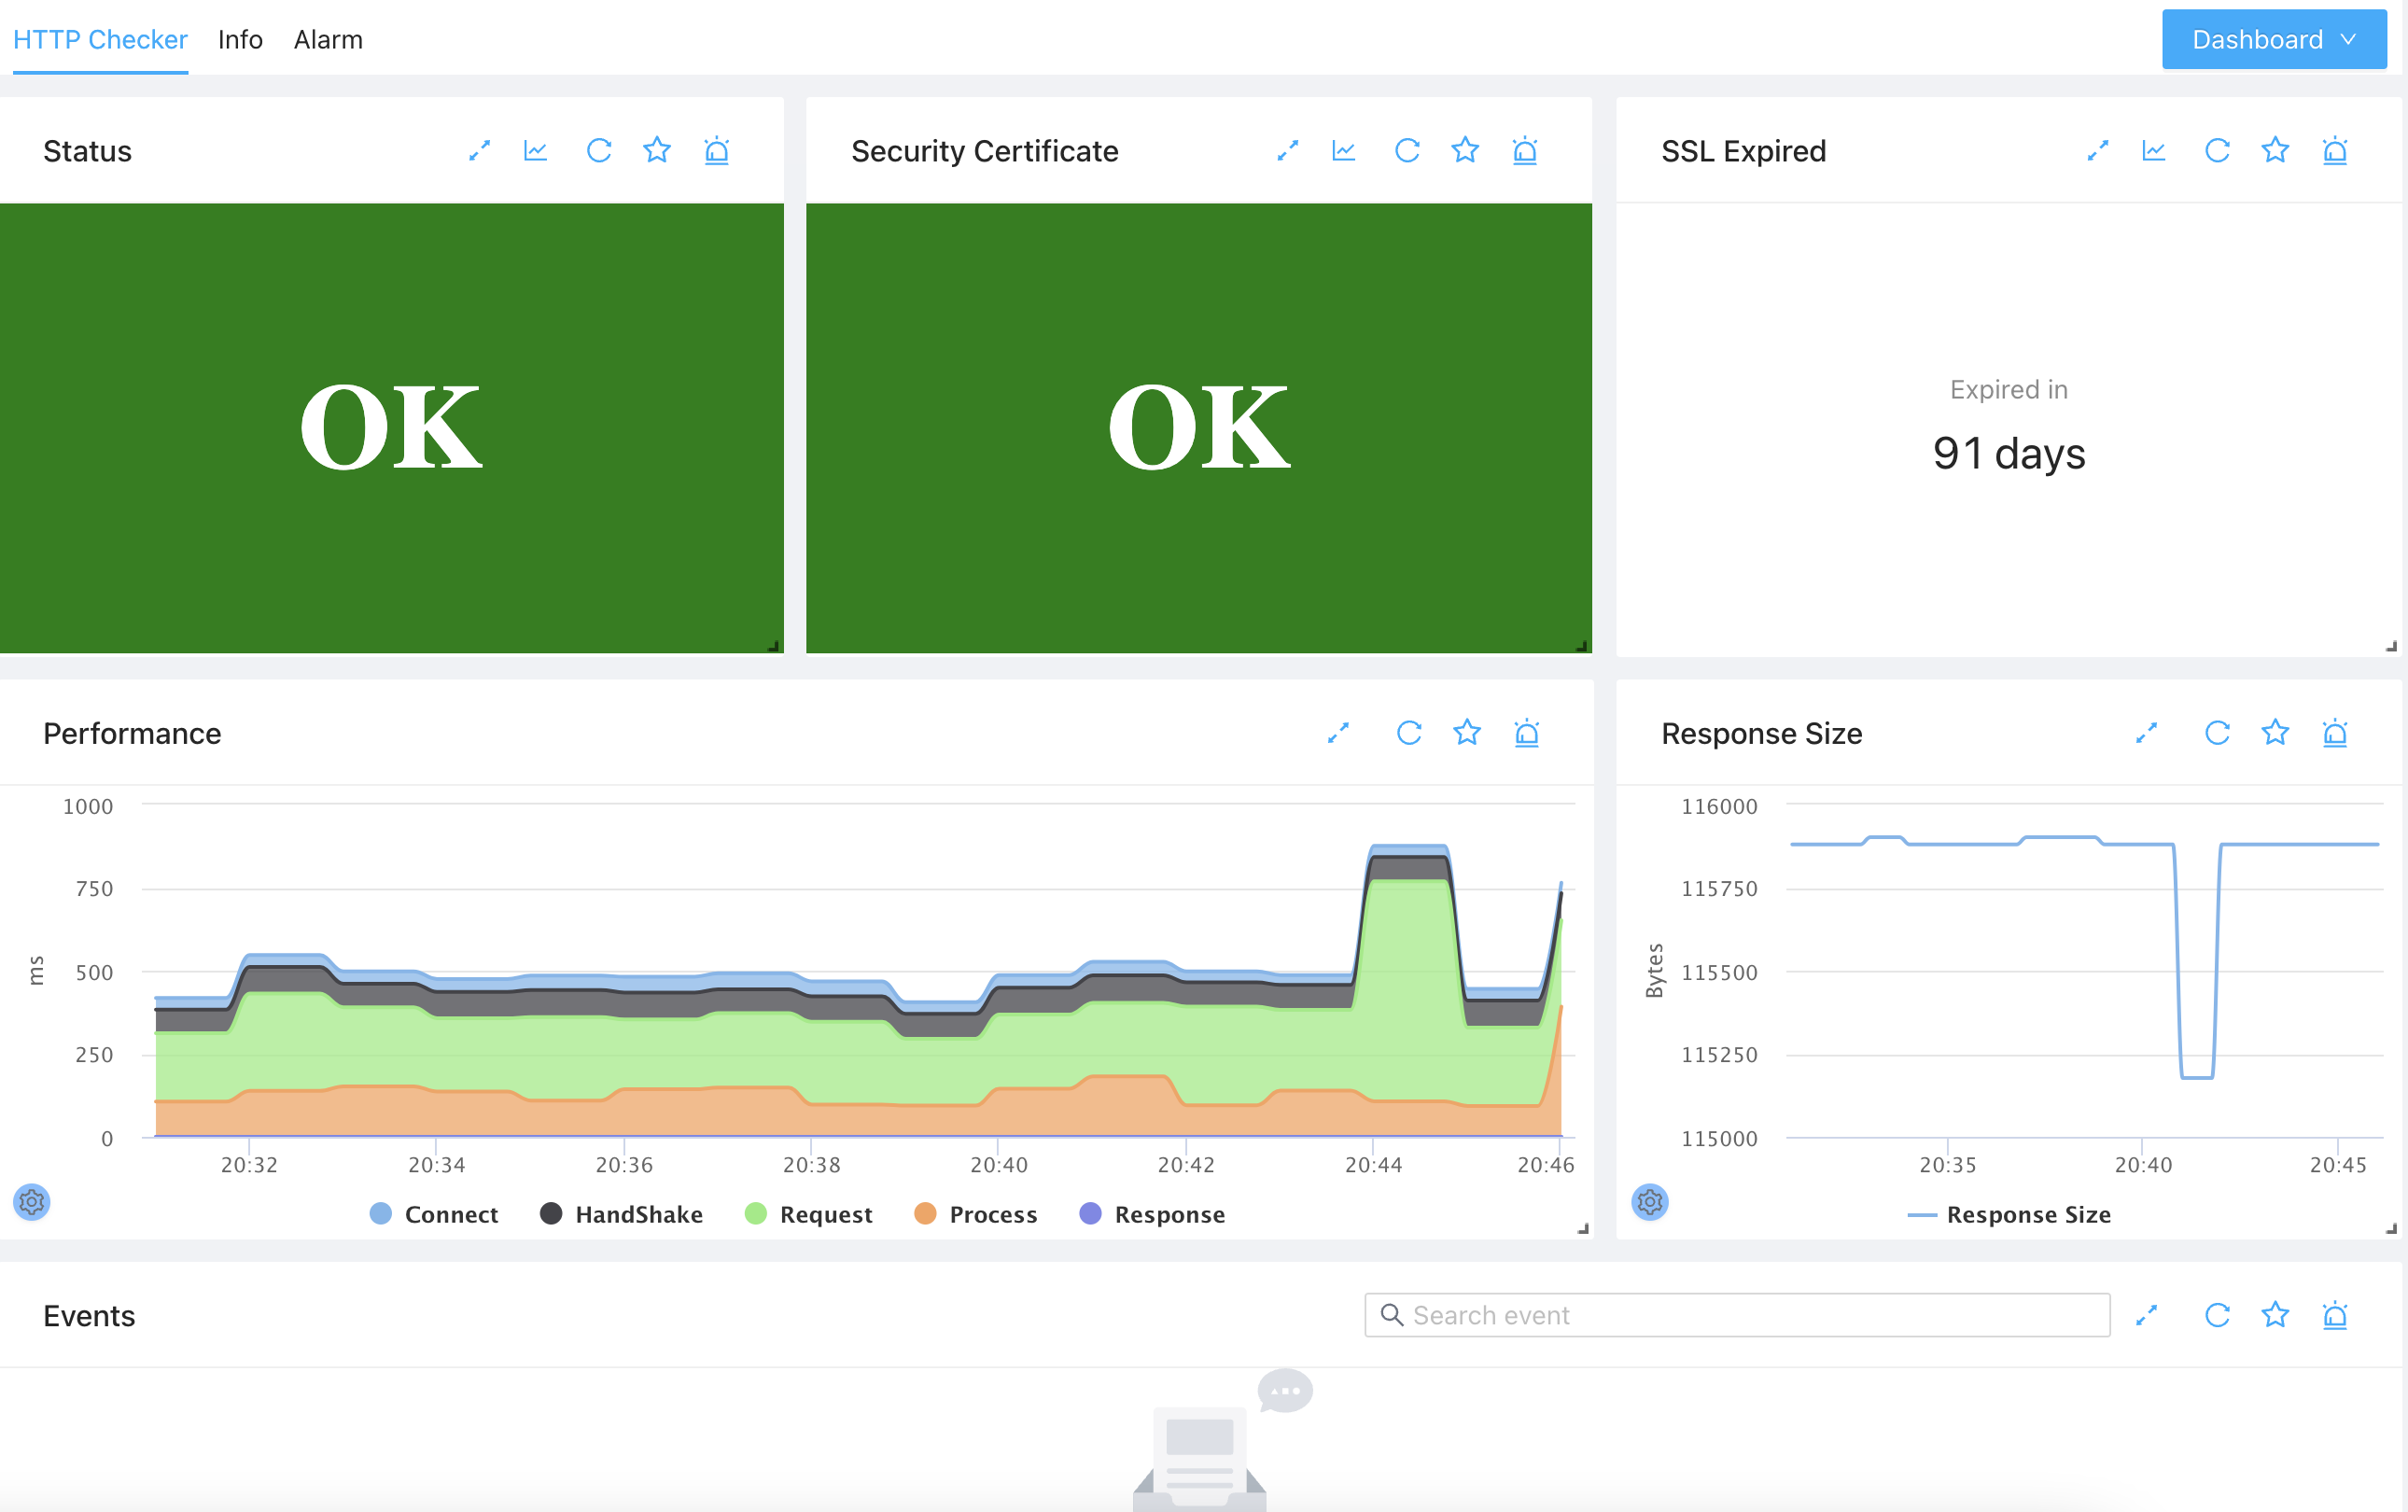
First you can see the overall status in Status widget for the monitored URL. If everything is OK, you can see the green OK, otherwise, depending on the severity of the problem, you would see an orange or red error messages.
The values for metric status:
| Value | Note |
|---|---|
| 0 | OK |
| 1 | Http request failure |
| 2 | Unknown internal error |
| 3 | Dns error eg unknown host name |
| 4 | Connection error eg fail to connect |
| 5 | SSL error. See the sslStatus for detail information |
| 6 | Previous step failed |
| 11 | HTTP code mismatch |
| 21 | HTTP header mismatch |
| 31 | HTTP content mismatch |
If the URL monitored is a HTTPS link, you’ll also see the certificate status in Security Certificate widget. Like the overall status, if everything is OK a green OK is displayed, otherwise an error message is displayed in orange or red color.
The value for metric sslStatus:
| Value | Note |
|---|---|
| 0 | OK |
| -1 | The ssl is not checked because maybe a dns error or connection failure |
| 1 | It’s a http endpoint |
| 2 | Certificate is expired |
| 3 | Certificate is not valid yet |
| 4 | Certificate is not trusted |
| 5 | The SNI is mismatch |
| 6 | Certificate is revoked |
For HTTPS link, besides the certificate status, the certificate expiration is also shown up in the SSL Expired widget, you can set alerts to remind you before your certificate expires.
You will aslo be able to see the url link access performance in Performance and Response Size widgets. It is worth noticing that the accessing performance is fine-measured and can be decoupled to several sub-metrics:
- Connect: this is the time taken to connect to the host servicing the url
- Handshake: if this is a HTTPS url, the time taken for establishing SSL connections
- Request: the time taken to send the request to server
- Process: the time taken for the server to send back first byte of data after fully receiving the request
- Response: the time taken for the server to send back all the data