Kafka Monitoring
ZoomPhant provides an easy way for you to monitor one or more kafka cluster using Kafka plugin.
Creating Kafka Monitoring
To start monitor a kafka cluster, you can choose the Kafka plugin as shown in Add Monitor Service and provide following necessary parameters to create a monitoring service:
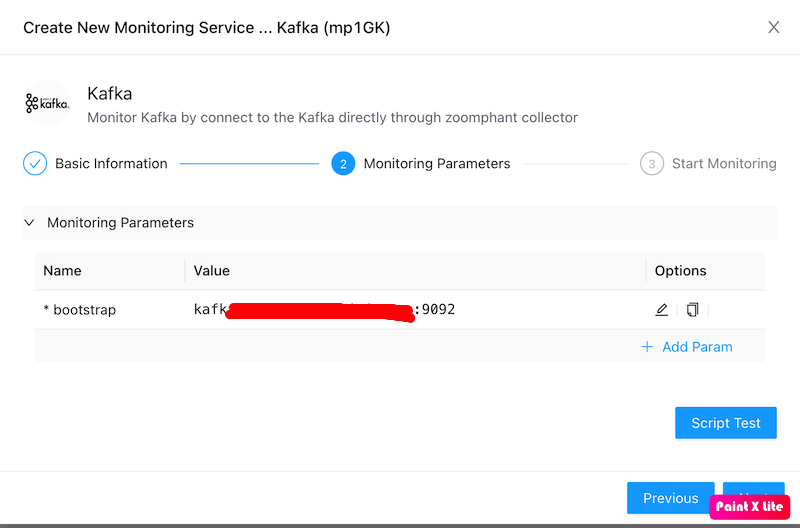
- bootstrap: the bootstrap urls for a kafka cluster.
With the parameters provided and the monitoring service been created, you can wait few seconds and see the diagrams for the monitored device.
Understanding Kafka Data
Kafka monitoring data are presented in straigtforward ways as shown below:
Cluster dashboard
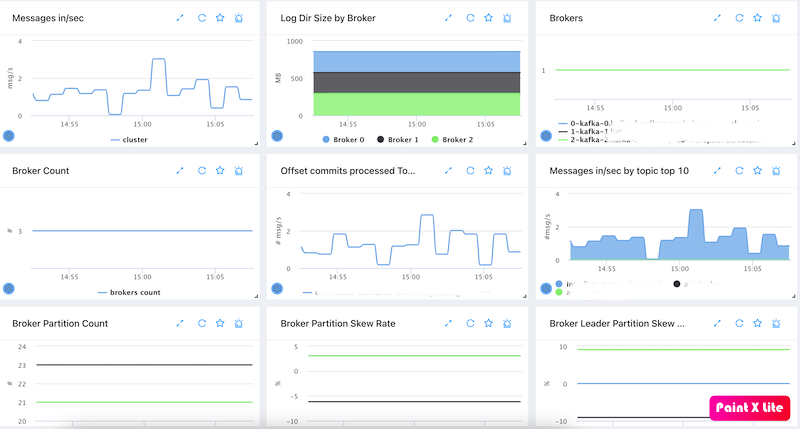
It contains below metrics:
- Messages in per cluster level
- Log directory size per broker
- Broker status & broker count
- Offsets committed rate top 10
- Messages in by topic top 10
- Broker partitions count
- Broker partition skew rate. The partitions per broker divides the avg partitions count
- Broker leader partition skew rate
Consumer group dashboard
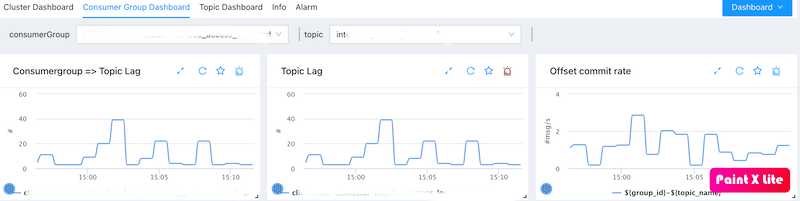
It contains below metrics:
- consumer group level topic lag
- offset commit rate per consumer group
Topic dashboard
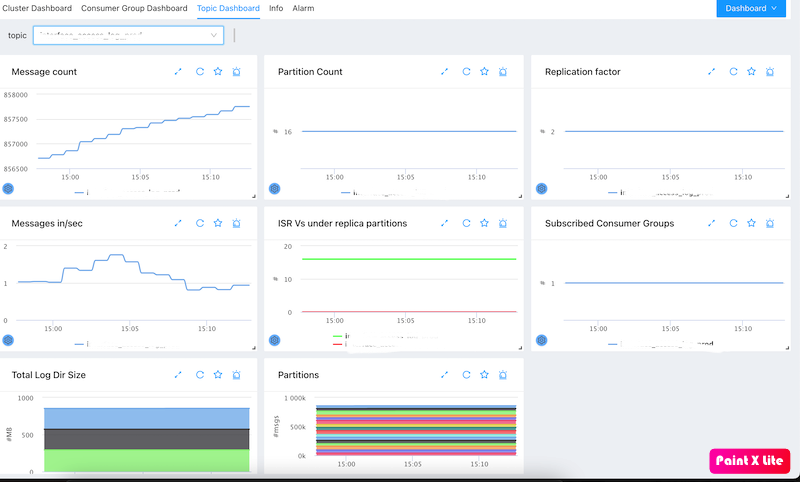
It contains below metrics:
- messages count for a topic
- partition count for a topic
- replication factor for a topic
- messages in per topic
- In sync replicas (ISR) and Under replica partitions (URP, which partition doesn’t have enough replica)
- Subscribed consumer groups count
- Log directory size for this topic in brokers
- Partitions messages offset for topic
Monitoring Multiple Kafka Clusters
You can monitor multiple kafka clusters by adding more services.