Redis Monitoring
ZoomPhant provides an easy way for you to monitor redis servers or clusters using Redis plugin.
Creating Redis Monitoring
To start monitor a redis server, you can choose the Redis plugin as shown in Add Monitor Service and provide following necessary parameters to create a monitoring service:
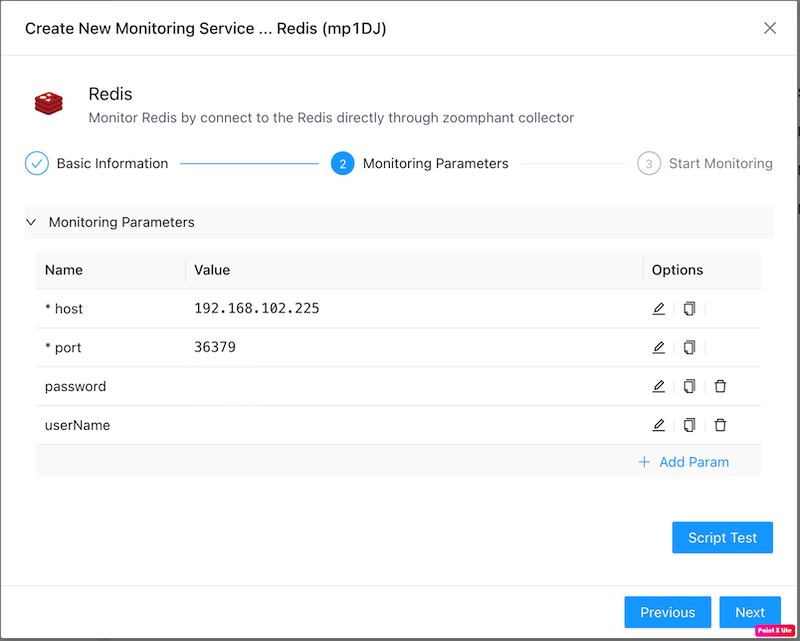
- host: the host for a redis server.
- port: the port for a redis server. eg: 6379
- password: optional, the password for a redis server.
- userName: optional, the userName for a redis server.
With the parameters provided and the monitoring service been created, you can wait few seconds and see the diagrams for the monitored redis service.
Understanding Redis Data
Redis monitoring data are presented in straigtforward ways as shown below:
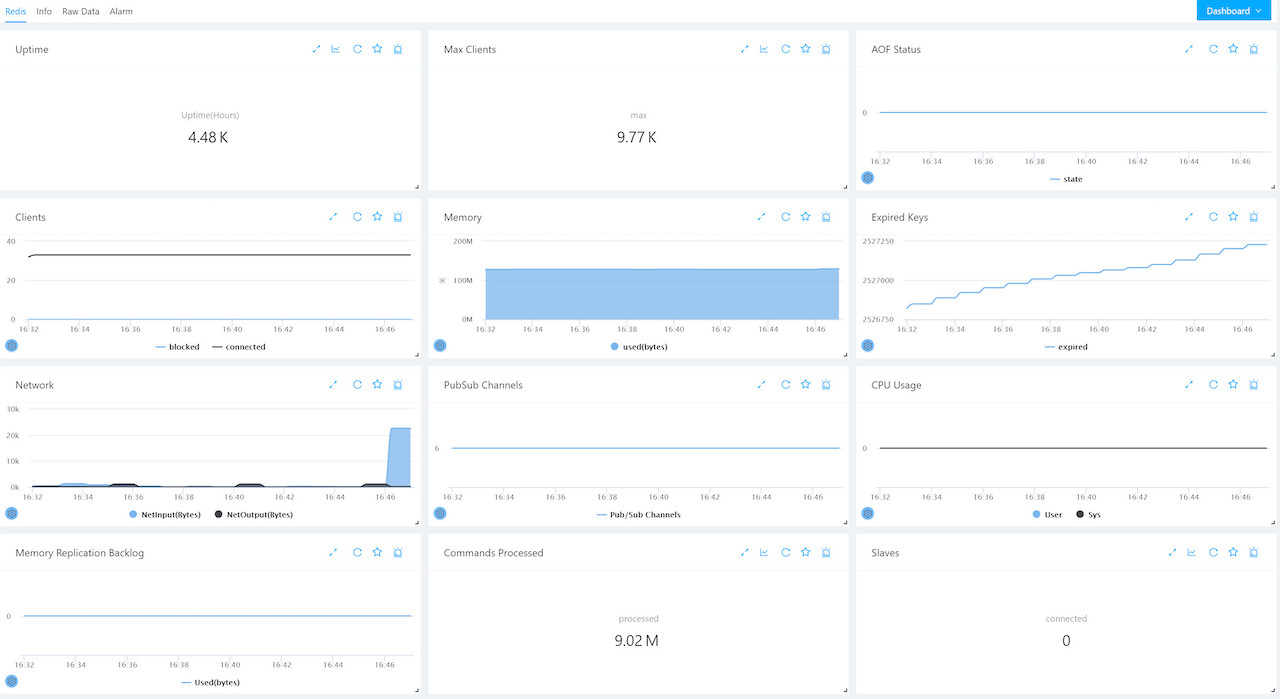
It contains below metrics for a redis server:
- Uptime in hours
- Max clients
- AOF (Append only file) feature status (0 is disabled)
- Connected and blocked clients
- Memory used
- Expired keys count
- Input and output network bytes in seconds
- Pub and subscribed channels
- User and sys cpu usage
- Memory replication backlog
- Commands processed
- Connected slaves