Sql query exporter
ZoomPhant provides an easy way for you to do a sql query to export metrics. For now, we support below databases to generate metrics:
- Microsoft SQL Server
- Oracle
- MySQL
- PostgreSQL
- ClickHouse
Creating SQL query exporter monitoring
To do a sql query to extract metrics, you can choose the Sql query exporter plugin as shown in Add Monitor Service and provide following necessary parameters to create a monitoring service:
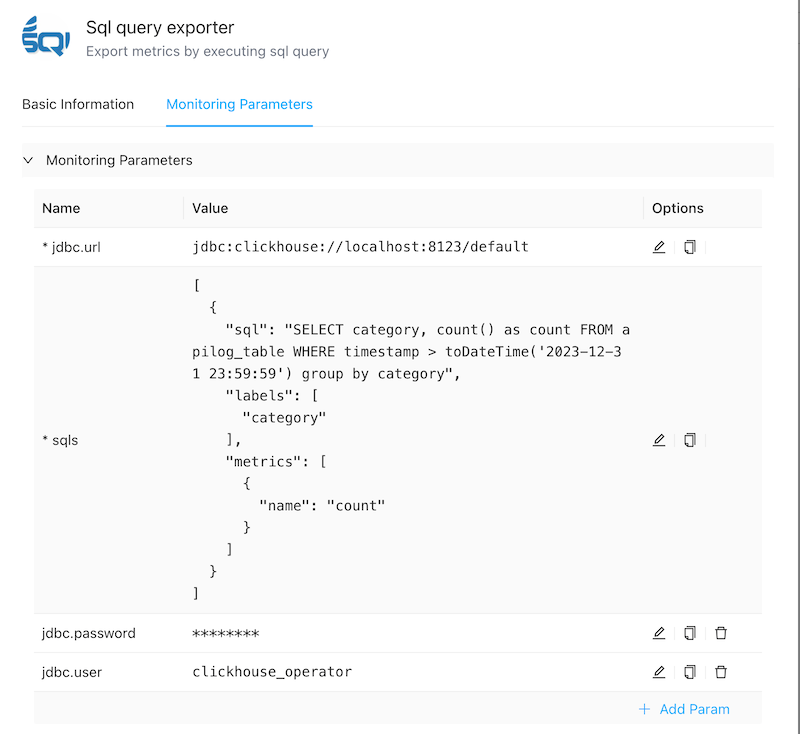
jdbc.url: required. the jdbc url. below are some examples:
Database type jdbc.url example SQL Server jdbc:sqlserver://localhost:1433;databaseName=mydatabase;user=myuser;password=mypassword MySQL jdbc:mysql://localhost:3306/mydatabase Postgres SQL jdbc:postgresql://localhost:5432/mydatabase Oracle jdbc:oracle:thin:@//localhost:1521/XE Clickhouse jdbc:clickhouse://localhost:8123/default sqls: required. a json array to describe the metrics definition. we support a list of sqls to generate multiple metrics to improve performance. Here are the example:
[{
	"sql": "the sql to query",
	"labels": ["label1", "label2"],
	"metrics": [{
		"name": "metric1"
	}, {
		"name": "metric2"
	}]
}]
The
sqldescribe the sql to generate metric. you can define multiple query to get different metrics. thelabelsindicates the column names in sql which will be treat as labels. An example :[{ "sql": "SELECT category, count() as count FROM apilog_table WHERE timestamp > toDateTime('2023-12-31 23:59:59') group by category", "labels": ["category"], "metrics": [{ "name": "count" }] }]jdbc.user: optional. the jdbc user.
jdbc.password: optional. the jdbc password.
Note: we will run the sql query in READONLY mode to keep your data secure.
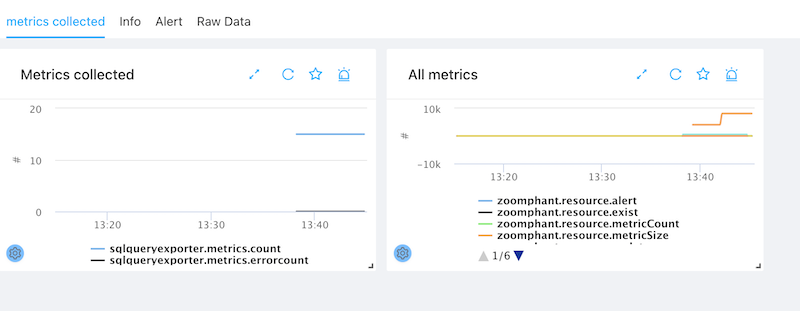
Understanding sql query exporter data
By default, there are two default graphs:
- Metrics Collected graph: show how many metrics are reported from the sql query.
- All metrics graph: show all the metrics reported.
Add custom dashboard
You can add custom dashboard following the manual Dashboards to get more details.